
Designing for data in the open
A national platform for the U.S. Department of Education, serving data on 500K+ students. I built its technical core: a REST API, an MCP server deployed as a live pilot so that any AI assistant can reliably get the numbers with their uncertainty and citations attached, and a data-crosswalking capability that overlays assessment data with external data sources. On top sit a custom visualization system, an agentic workflow that turns questions into purpose-built tools, and a web app whose telemetry shapes what each user sees next. Ongoing through December 2026.
The problem
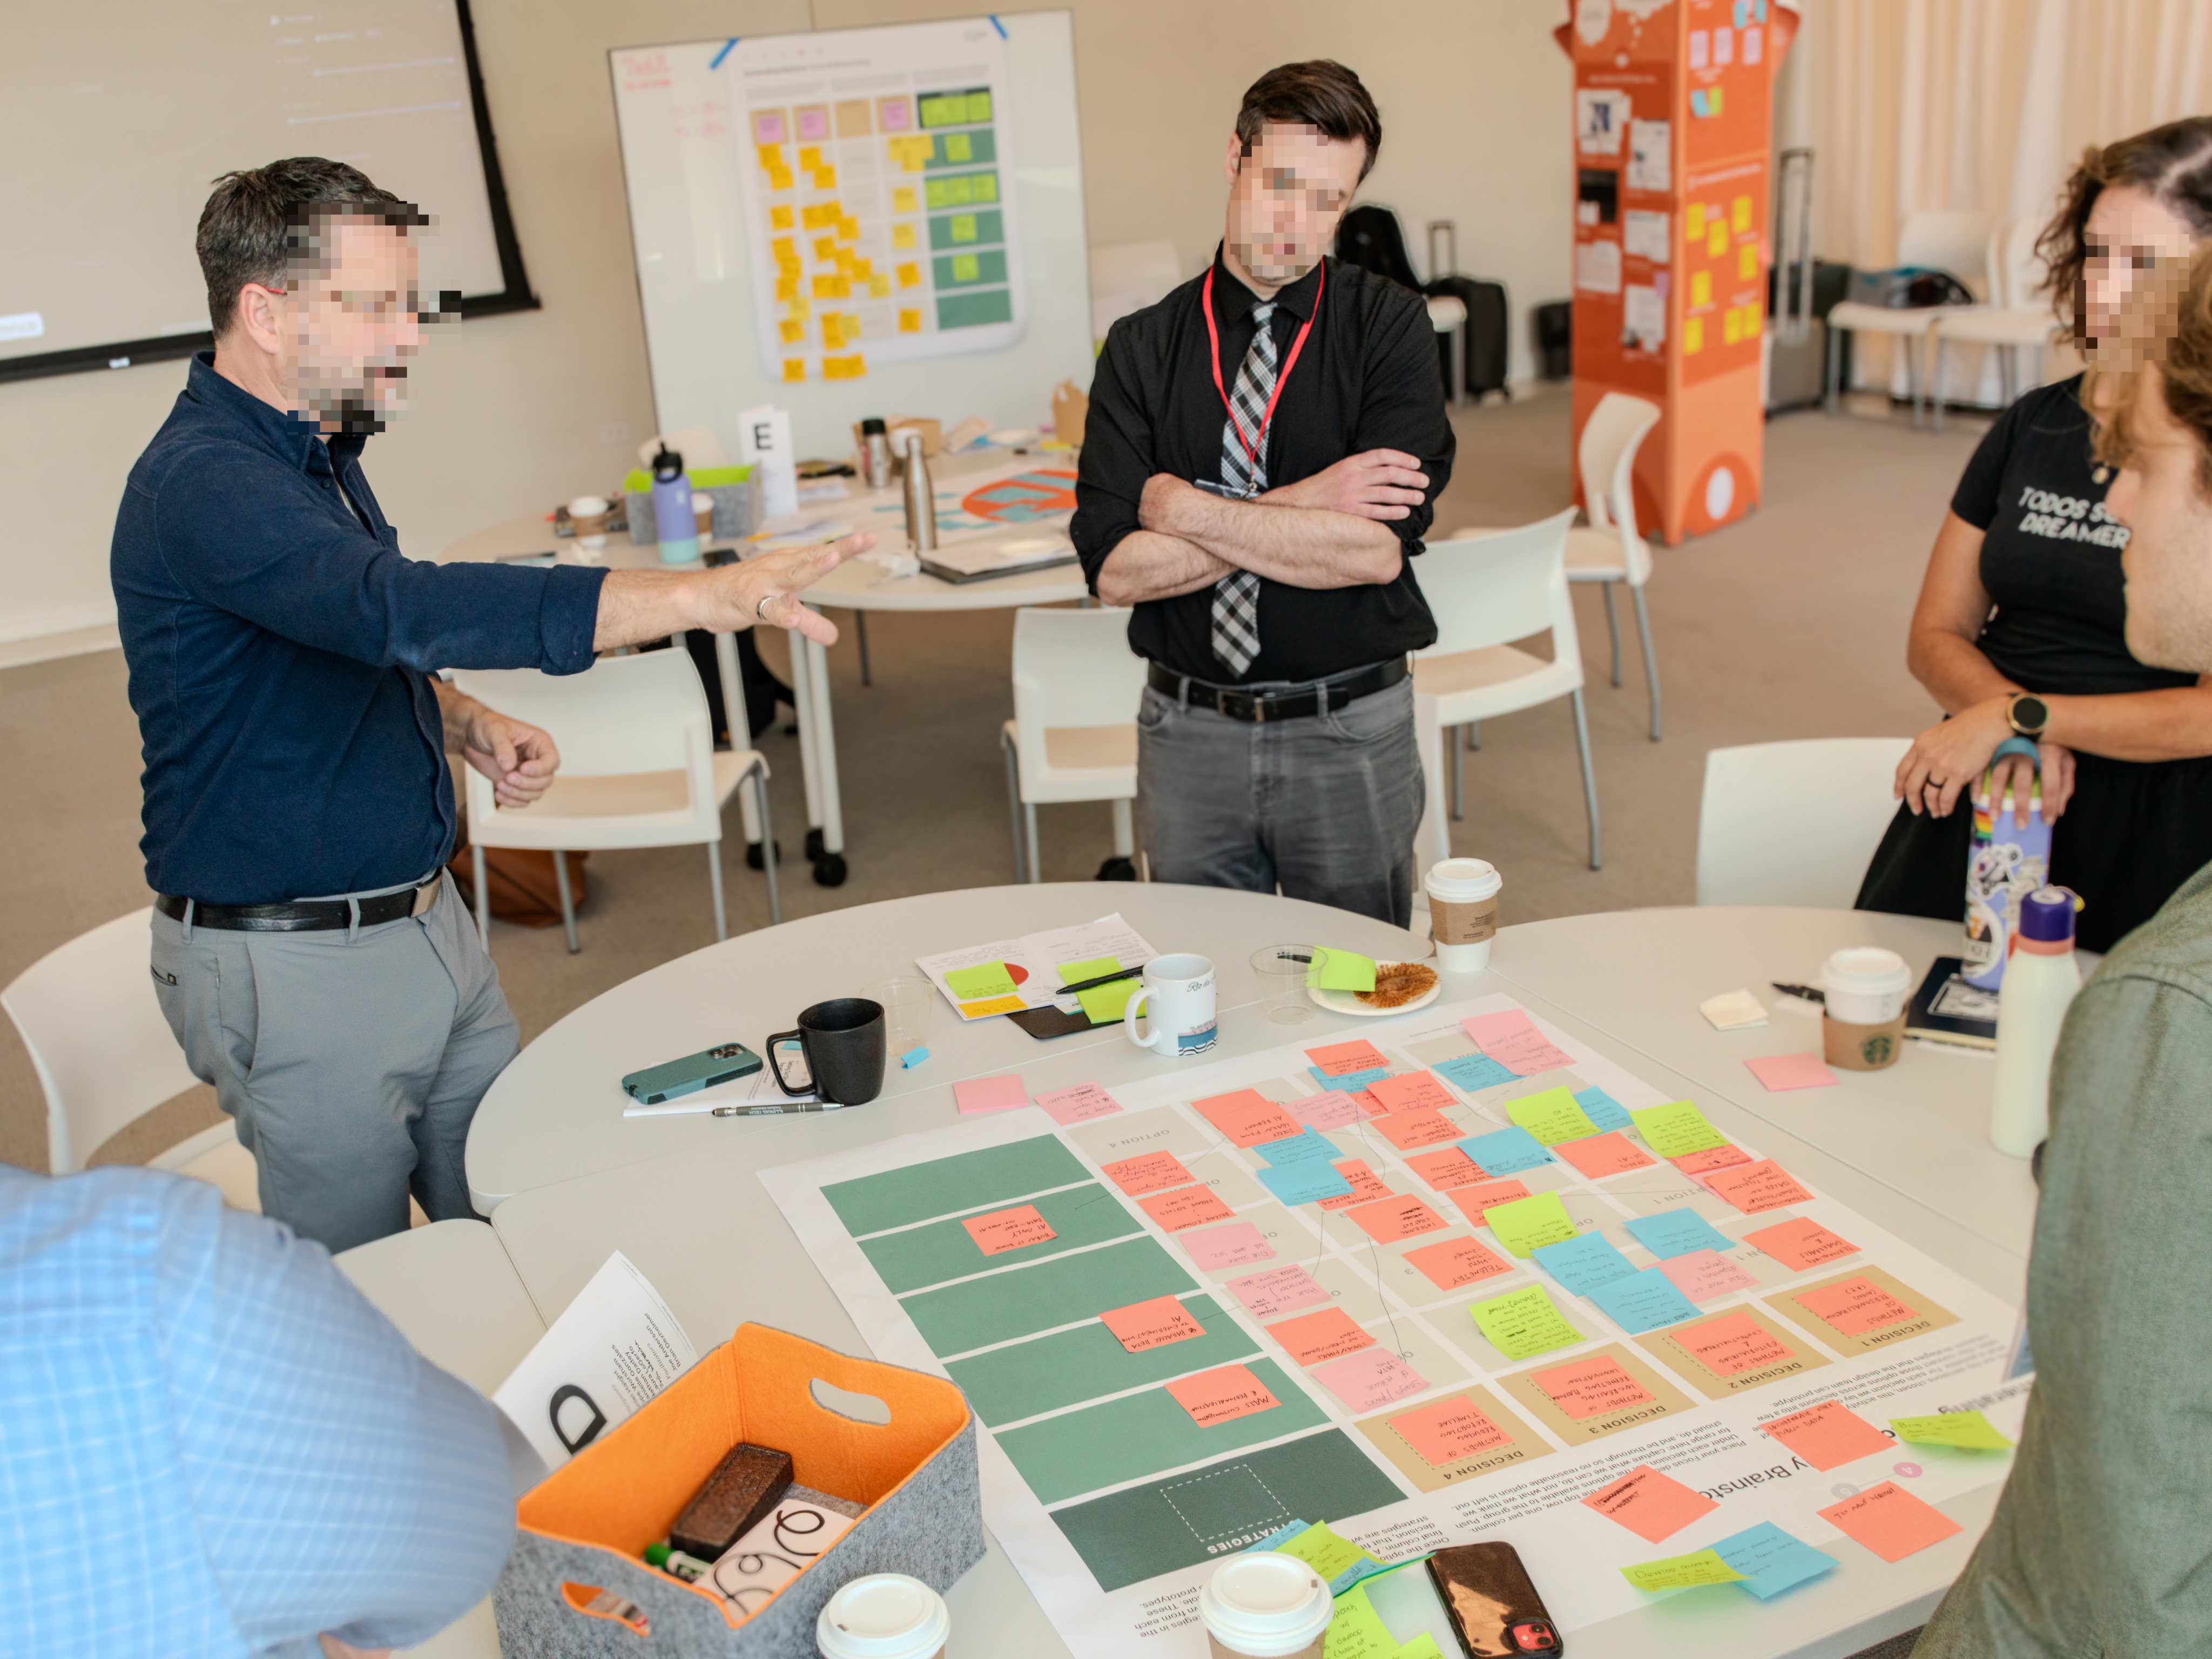
The client is the United States Department of Education, which runs a national education data program informing policy from the federal level down to individual schools. The mandate was open: identify meaningful AI integration for the next iteration of the program’s data infrastructure. Before anything could be built, an undefined scope had to survive 50+ federal, state, and district stakeholders. Each had competing priorities and veto power over the direction. We aligned that scope through facilitated workshops and primary research. Only after that, we could move to designing and building the systems it called for.
How do you present national assessment data so that researchers, policymakers, and the public can actually use it, and get external probabilistic AI systems to accurately and reliably reference and work with the data?
Constraints
| Timeline | 20+ interviews synthesized in two weeks, in time to shape the upcoming stakeholder workshop. |
|---|---|
| Stakeholders | 50+ stakeholders, from federal agencies down to districts, each with institutional priorities that felt non-negotiable. |
| Data / domain | Longitudinal national assessment data with uncertainty, suppression, and comparability rules attached to every number. Misreading any of them produces a wrong headline. |
| Business need | External AI systems already consume this public data, reliably or not. The platform had to make correct machine consumption the easy path. |
Key decisions
Every choice had to hold up twice: to stakeholders who could veto it, and to the team who would build on it.
The stakeholder interviews were too sensitive to send to a third-party API and too valuable to leave as static transcripts. I built a fully local RAG pipeline: transcripts go into a vector database, and retrieval feeds a local LLM. The team could interrogate stakeholder perspectives on demand. When others needed access, I exposed the app through a tunnel instead of moving the data.
The service is split at a hard seam. An AI resolver turns natural-language queries into resolved parameters, and a deterministic core produces the data, whether the request arrives over REST or through the MCP tools I designed for external AI assistants. Identical resolved queries return identical results. Every response echoes how it was resolved, and the AI never touches the numbers. That is what lets researchers and newsrooms cite the output.
When the resolver maps open vocabulary onto assessment concepts, its output is never a freeform claim. It is a pointer into a human-authored registry of official, cited definitions. The model can pick the wrong entry, but that mistake is visible and testable. It cannot fabricate an equivalence.
Instead of building a separate integration for each audience, I designed one request schema that the REST API and the MCP server share. A researcher’s script and an AI assistant send the same query and get the same numbers back. Uncertainty and citations travel with every response, so no caller gets a stripped-down version of the data.
Once data is public, interpretation belongs to whoever opens the file. No caveat survives contact with a deadline. Uncertainty is drawn inside the visualization itself, and methodological context appears at the point of use. When a query invites misinterpretation, the LLM redirects it toward sources instead of answering badly.
The system
One contract, two surfaces. A REST API and an MCP server share a single request schema, so every caller, human or AI, hits the same deterministic core. Every response carries its citations and decoded data flags. Definitions are quoted verbatim from official sources, never paraphrased.
The server is deployed as a live pilot in testing. A reader asks a loose question in their own words: what were the reading and math grades in 2024? The answer gives scale scores by grade and year, with each change marked significant or not. It warns that reading and math sit on different scales and cannot be compared. It notes that every 2024 figure is still below 2019. And it names its source. The guardrails travel with the numbers, into a conversation happening somewhere I will never see.
On top of the service sits the presentation layer. The team built a visualization design system and chart taxonomy that draws prediction uncertainty over longitudinal data into the views themselves. Alongside it, a crosswalk layer judges whether an external dataset can validly overlay onto the assessment data at all, and cites its verdict. LLMs run through the whole pipeline, from the web app to the MCP server. The AI integration strategy was scoped from primary research with 50+ stakeholders, so every capability maps to demonstrated demand.
The crosswalk is where most of the misreading risk lives. Someone arrives with a county-level CDC vulnerability file or a Census income series and wants it on the same picture as assessment scores. An AI reads the unfamiliar column shapes into geography, year, and value — it maps, it never renames or merges — and then the harness says out loud what the join actually costs. The assessment score exists only at state level and cannot be pushed down to a county. If no assessment was given in the years being charted, the nearest one is shown for context and never substituted. The two sources share place and time but keep their own scales. Every overlay is stamped approximate, and the resolved request is left open for inspection at the seam.
Outcomes
Fifty-plus stakeholders aligned on a scope that did not exist when the engagement started, and that scope is now running code. The API and the MCP server have both moved from local prototypes to a deployed pilot I built and maintain. It runs end to end and is under active testing. The guardrails I designed travel with the data into every client that connects to the pilot. Work continues through December 2026.